In August I published a post examining a common question in email marketing – do email subscription pop-ups work? The post detailed how I went about implementing pop-ups via OptinMonster (affiliate), as well as the results I attained in using them on two separate sites. Despite “most people” claiming they hate them, the results were clear: email list subscription pop-ups work – and they work well.
I received an interesting follow-up question from one of my list subscribers in an email:
“Have you found any difference in the quality and engagement of pop-up subscribers vs. subscribers obtained through other methods?”
It was a question I didn’t have a data-based answer for at the time. But it’s been almost six months since I wrote that post and now I have some long-term data to look at when comparing the behavior of subscribers obtained via the pop-up acquisition method vs. other methods.
I took a look at the stats for my Sound Bites newsletter from September 1st, 2015 through January 15th, 2016. My subscription rates have maintained the increases in signups, confirmations and conversion rates over time that they experienced with the initial use of the popup:
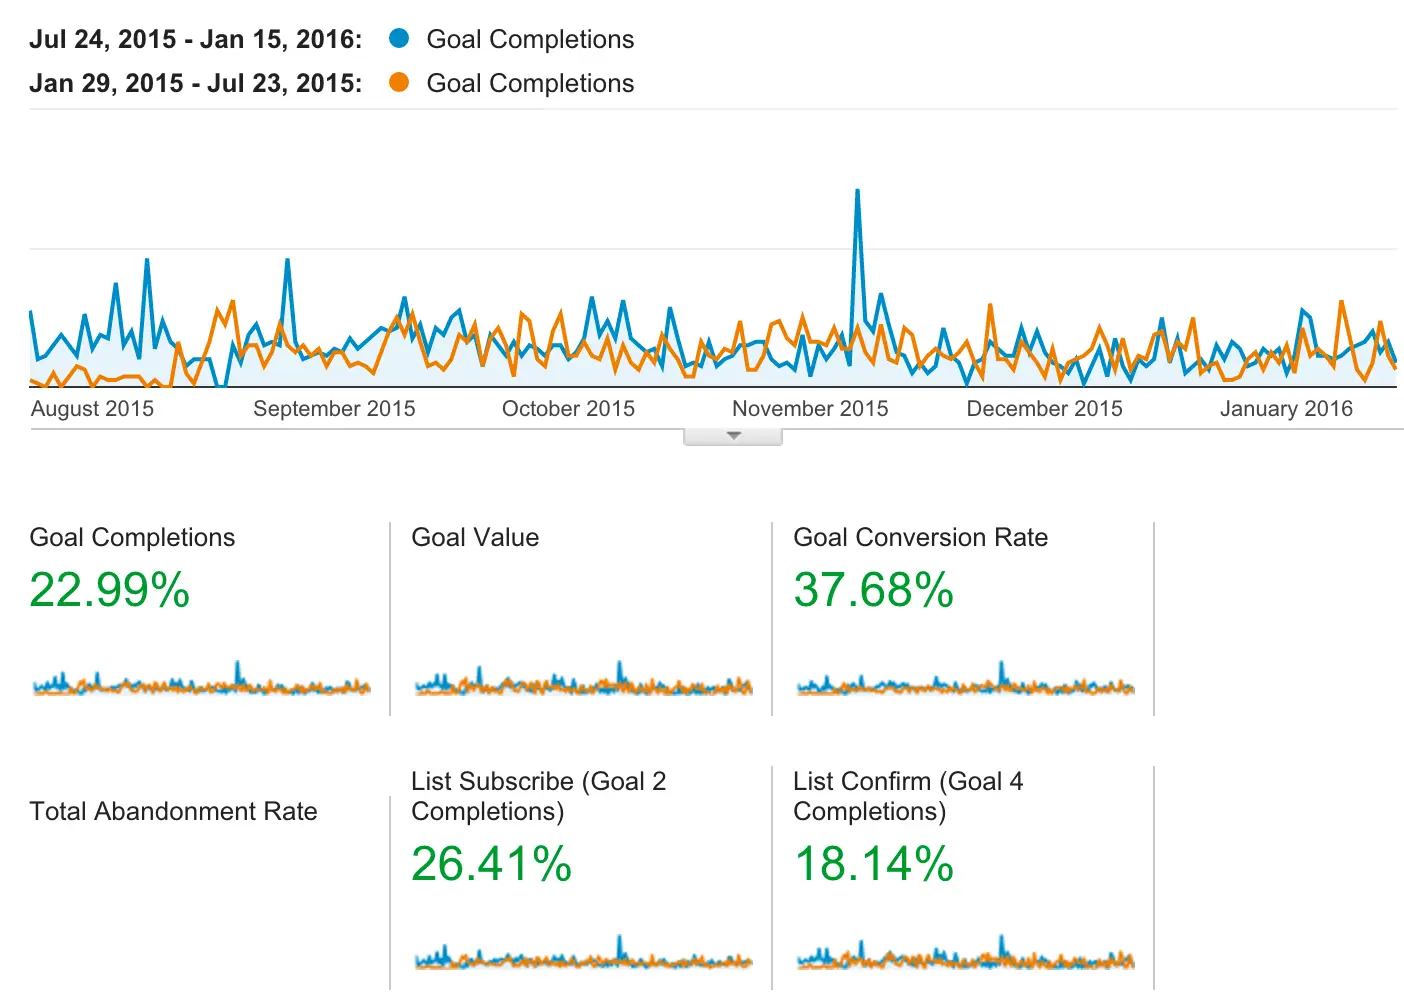
*Note: The photo for this article is edited. No information shown in the photo is altered – some of the statistical information is merely removed, and a blank space appears in its place.
But what about the quality of those signups?
Here’s what I found:
Confirmed subscribers:
- Percentage of non pop-up subscribers since 9/1/15 that confirmed their subscription: 88.1%
- Percentage of pop-up subscribers since 9/1/15 that confirmed their subscription: 84.45%
Follow up message open rates:
- Open rate of my follow-up message to confirmed non pop-up subscribers: 69.61%
- Open rate of my follow-up message to confirmed pop-up subscribers: 68.66%
Unsubscribe rates:
- Percentage of confirmed non pop-up subscribers since 9/1/15 that have unsubscribed: 5.19%
- Percentage of confirmed pop-up subscribers since 9/1/15 that have unsubscribed: 7.46%
No opens rates:
- Percentage of confirmed non pop-up subscribers since 9/1/15 that have never opened an email from me: 19.22%
- Percentage of confirmed pop-up subscribers since 9/1/15 that have never opened an email from me: 18.4%
Last week’s open rates for Sound Bites:
- Percentage of confirmed non pop-up subscribers since 9/1/15 that opened last week’s Sound Bites: 28.31%
- Percentage of confirmed pop-up subscribers since 9/1/15 that opened last week’s Sound Bites: 28.36%
My open rates for both pop-up subscribers and subscribers via other methods are both higher than my industry averages according to this data from Mail Chimp and these stats published by ConstantContact.
Comparing Conversions
Comparing the percentage of subscribers who click on links within my newsletter is a lot trickier to do. Aweber, unfortunately, doesn’t allow you to segment subscriber data by “clicked any link” and instead makes you choose to segment subscribers that have clicked on clicking individual links in specific newsletters. So, to tell you how many subscribers clicked through to my Pinterest case study, I’d have to find every newsletter I’ve ever linked to it in and pull the stats for each link. And that would only tell me the number of click-throughs.
Because I was never able to get Aweber‘s Sale Tracking feature to work properly before I launched the study, I can’t pull sales numbers – as tracked by Aweber – either. That’s been on my list as a to-do item for a while, so I’ll probably work on getting that situated over the next month, so I get some insight into the conversion rates for pop-up subscribers vs. subscribers via other methods. If and when I’m able to do that, I’ll update this post with that data.
Another challenge in comparing conversion data is that I can’t track most of my “conversions” from that granular of a level. My Pinterest case study is a clear-cut conversion that I can track via Aweber’s sales tracking. However, comparing clicks and conversions for affiliate links, as well as AdSense – segmented by and matched up to my granular Aweber subscriber data – is not something I can do.
The bottom line
It would seem – for Sound Bites – there has been no significant difference between subscribers that subscribe via my pop–up vs. other subscription methods on the site. They exhibit almost identical behavior and engagement metrics. Considering that pop-ups have unarguably increased my sign ups without any loss of subscriber quality, I’ll be continuing to use them on any site where building an email list is a primary goal.
As always, I recommend you run your own tests. These are the results for one site, in one niche. But this post should give you some insight into what metrics you can look at to make your own conclusions about what works for your site.
Do you have any data to share?
Have you taken the time to compare the quality of newsletter subscribers via various methods? If so, I’d love to hear what you’ve found in the comments below.