This is a joint post with Inbar Naor. Originally published at engineering.taboola.com.
Now that we know what uncertainty
types exist
and learned some ways to model
them, we
can start talking about how to use them in our application.
In this post we’ll introduce the exploration-exploitation problem and show you
how uncertainty can help in solving it. We’ll focus on exploration in
recommender systems, but the same idea can be applied in many applications of
reinforcement learning — self driving cars, robots, etc.
The goal of a recommender system is to recommend items that the users might find
relevant. At Taboola, relevance is expressed via a click: we show a widget
containing content recommendations, and the users choose if they want to click
on one of the items.
The probability of the user clicking on an item is called Click Through Rate
(CTR). If we knew the CTR of all the items, the problem of which items to
recommend would be easy: simply recommend the items with the highest CTR.
The problem is that we don’t know what the CTR is. We have a model that
estimates it, but it’s obviously not perfect. Some of the reasons for the
imperfection are the uncertainty types inherent in recommender systems, which we
discussed in the first post of the
series.
So now we’re facing a challenging situation — one that we’re all familiar with
from our day-to-day lives: imagine you’ve just entered an ice cream shop. You
now face a crucial decision — out of about 30 flavors you need to choose only
one!
You can go with two strategies: either go with that favorite flavor of yours
that you already know is the best; or explore new flavors you never tried
before, and maybe find a new best flavor.
These two strategies — exploitation and exploration — can also be used when
recommending content. We can either exploit items that have high CTR with high
certainty — maybe because these items have been shown thousands of times to
similar users; or we can explore new items we haven’t shown to many users in the
past. Incorporating exploration into your recommendation strategy is crucial —
without it new items don’t stand a chance against older, more familiar ones.
The easiest exploration-exploitation approach you can implement is the ϵ-greedy
algorithm, where you allocate ϵ percents of the traffic to explore new items in
a random manner. The rest of the traffic is reserved for exploitation.
Despite not being optimal, this method is easy to understand. It can serve as a
solid baseline for more sophisticated approaches. So how can we look for good
items in a wiser manner?
looking for good items in a wise manner
A more advanced approach — Upper Confidence Bound (UCB) — uses uncertainty.
Each item is associated with its expected CTR, and confidence bound over that
CTR. The confidence bound captures how uncertain we are about the item’s CTR.
The vanilla UCB algorithm keeps track of the expected CTR and confidence bound
by using empirical information alone: for each item we keep track of the
empirical CTR (what percent of similar users have clicked on it), and the
confidence bound is calculated by assuming a binomial distribution.
Take for example the plain chocolate flavor you always order. You know it’s good
— you give it 8 stars out of 10. Today a new flavor has arrived. You have no
empiric information about it, which means it can be anything from 1 to 10 stars.
Using this confidence interval, if you would want to explore you’d go with the
new flavor, since there’s the chance it’ll be a 10 stars flavor.
That strategy is exactly what UCB is all about — you choose the item with the
highest upper confidence bound value — in our case confidence bound over CTR
estimation. The motivation behind this strategy is that over time the empiric
CTR will tend towards the true CTR, and the confidence bound will shrink to 0.
After enough time, we’ll explore everything.
Another popular approach is the Thompson Sampling method. In this approach we
use the entire estimated distribution over the item’s CTR instead of only a
confidence bound. For each item we sample a CTR out of its distribution.
These approaches might work well when the number of available items is fixed.
Unfortunately, at Taboola every day thousands of new items enter the system, and
others become obsolete. By the time we get a reasonable confidence bound for an
item it might leave the system. Our efforts would have been in vain. It’s like
doing a world tour, each day visiting a new town with a vast amount of ice cream
flavors to explore. The horror!
We need an approach that can estimate the CTR of a new item without showing it
even once. We need some food critic magazine that will guide us through the
buffet of content recommendations.
Consider a new type of chocolate flavor that just arrived. Since you know you
love chocolate you have a pretty good guess that you’ll like the new flavor too.
In the vanilla UCB approach (no, that’s not a name of a flavor), you won’t be
able to infer it — you rely on empirical information only.
In a future post we’ll elaborate on how we use a neural network to estimate the
CTR of a new item, as well as the level of uncertainty. Using this uncertainty,
we can apply the UCB approach in order to explore new items. Unlike the vanilla
UCB that relies on empirical data, here we can use the model’s estimation to
avoid showing items with low CTR. We can gamble on the horses we think will
win.
🐎
How can we know how well we explore new items? We need some exploration
throughput metric. In Taboola we have A/B testing infrastructure supporting many
models running on different shares of traffic.
Back to ice cream! Let’s say you brought your friends to help you explore the
different flavors. Obviously if one of your friends randomly picks flavors, he
has the best exploration throughput, but not the smartest. The other friend that
orders the flavor the others have found tasty enjoys the most, but contributes
nothing to the exploration effort.
At Taboola we measure exploration throughput as follows: for each item that has
been shown enough times, and in enough different contexts (e.g — different web
sites) we declare that item to have crossed the exploration phase. Next, we
analyze which models contributed to this successful effort. In order to count, a
model has to show that item enough times.
Using this perspective, the throughput of a model is defined to be the number of
items it contributed to.
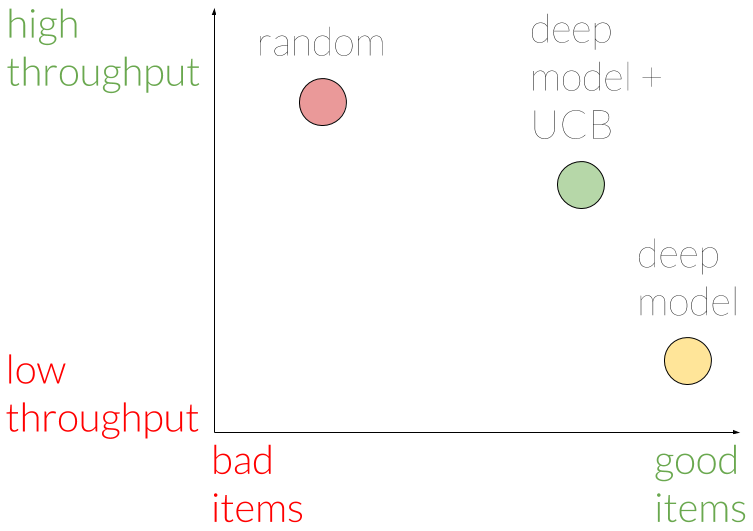
Using this metric, we were able to assert that indeed showing items randomly
yields the best throughput, but with a tendency for bad items. A model that
doesn’t use the UCB approach shows good items, but has worse throughput. The
model with UCB is somewhere between in terms of throughput, and shows only
slightly worse items compared to the non-UCB model.
Hence, we conclude our UCB model has a good tradeoff between exploring new
items, and choosing the good items. We believe this tradeoff is worthwhile in
the long term.
The exploration-exploitation problem is an exciting challenge for many companies
in the recommender systems domain. We hope our advancements will serve others in
their journey of providing the best service to their users. We believe this is a
small step in a big journey yet to be fulfilled, and we’re intrigued by the
thought of what shape this field will take in the following years.
In the next post of the series we’ll elaborate on the model we used for
estimating CTR and uncertainty, so stay tuned.
This is the third post of a series related to a paper we’re presenting in a
workshop in this year KDD conference: deep density networks and uncertainty in
recommender systems.
The first post can be found
here.
The second post can be found
here.


