[ad_1]
I have been following the North American and, to a lesser extent, global automotive industry for over ten years and have obsessively studied the roller coaster ride it has undergone over that period.
From the slew of bankruptcies precipitated by the 2008 financial recession to the humbling of industry giants, the rise of electric vehicles to the rapid adoption of self-driving technologies, and the consolidation of the industry to the sales slump caused by the COVID-induced chip crunch, there is certainly a lot I can talk about.
But rather than write an extensive report highlighting every major development the industry has experienced over the past 15 years, I am going to use this piece of internet real estate to assess the performance of the world’s biggest automakers and give each one a rating. Think of it as a report card.
As of the end of 2022, the largest global automotive groups in no particular order were Toyota, the Volkswagen Group, the Hyundai Group, Stellantis, General Motors, Ford, Honda, Nissan, BMW, Mercedes-Benz, Renault, Suzuki, Tesla, and Mazda.
For the sake of brevity, I excluded the large Chinese automakers from the analysis because, despite making headway in their efforts to expand internationally, they are still mostly relegated to their Chinese domestic market and are not serious global players… yet. You can bet that will change in the coming years.
Casual observers often make the mistake of only using a company’s revenue and sales volume to assess its overall health, but as you will soon see, these metrics hardly tell the whole story. Profitability is a more important measure of success.
So, in addition to sales volume and revenue, I will be looking at their net and operating profits, both in absolute amounts and as a percentage of their sales; how much profits they made per vehicle; and how much profits they made per employee.
This will give you a good idea of just how well each automaker has been managed.
Ranking by Unit Sales
Let’s kick off the analysis by ranking the automakers by how many vehicles they sold and how much revenue they generated in their fiscal year 2022.
Now, as eye-catching as both metrics are, they are not included in my rating system for two key reasons. First, as noted earlier, sales volume and revenue alone are not particularly useful for assessing the health of an automaker.
General Motors, for instance, was still the world’s largest automaker by volume not long before it filed for bankruptcy in 2009.
Second, including it in my rating would put the smaller automaker at a disadvantage. You might be surprised at just how incredibly successful a few of the small players are when you look beyond sales volume.
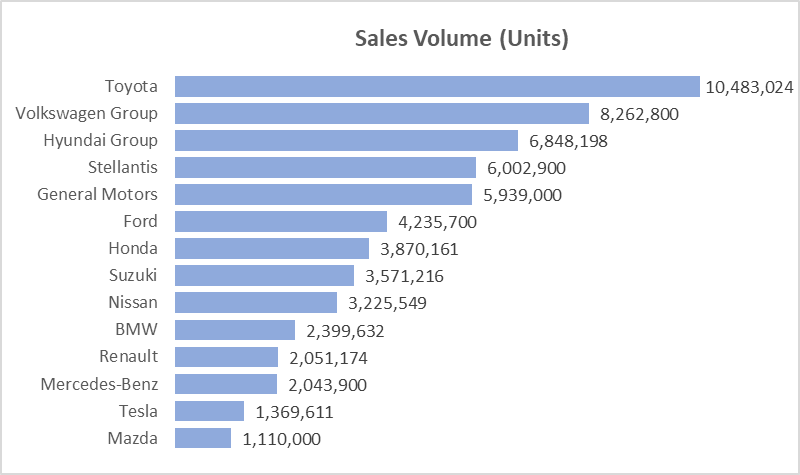
Disclaimer out of the way, Toyota, including all its subsidiaries such as Lexus and Hino, was the largest automaker in 2022, followed by the Volkswagen Group and its large collection of automotive brands.
The Hyundai Group, which includes Hyundai, Kia, and Genesis brands, came in third place, which will probably come as a surprise to many seeing as Korean automakers were bottom feeders just two decades ago.
Stellantis, an automotive group formed from the merger between the Italian–American conglomerate Fiat Chrysler Automobiles (FCA) and the French PSA Group in 2021, didn’t trail too far behind in fourth place.
General Motors, once the industry’s top dog, rounds out the top five.
Ford, Honda, Suzuki, and Nissan huddle in the middle, while household names like BMW, Mercedes-Benz, and Tesla take the 10th, 12th, and 13th place, respectively.
Keep the latter three automakers in mind for the revenue and profitability rankings.
It’s worth noting that automotive sales were severely impacted by COVID, with nearly every automaker experiencing a sales slump during the epidemic and having still not recovered fully as of the end of 2022.
Ranking by Revenue
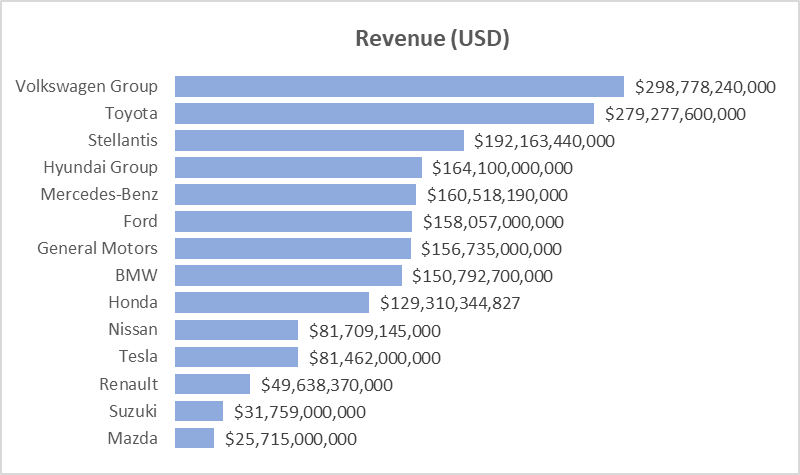
Revenue is the average sales price of a vehicle multiplied by the total number of vehicles sold, and there is some reshuffling with this ranking.
The Volkswagen Group displaces Toyota for the top spot, while Stellantis beats the Hyundai Group for third place mostly because Hyundai’s sales skew more towards affordable, lower-priced cars for developing markets than most other automakers.
The biggest jumps come from Mercedes-Benz at 5th and BMW at 8th, however, with Mercedes beating giants such as General Motors, Ford, and Honda.
Tesla also moved up the revenue ranking, though not as drastically as its German rivals. Even so, it’s impressive for such a relative upstart to make almost as much revenue as Nissan, an automaker that was among the top five largest in revenue not too long ago.
As with sales volume, revenue by itself is not included in my rating system because, despite some of the small automakers making big jumps in the ranking because of their luxury car branding allowing them to charge price premiums for their vehicles, revenue is still a metric that heavily favors large automakers.
Scale is king when it comes to revenue generation but not necessarily when it comes to profitability.
Ranking by Profitability
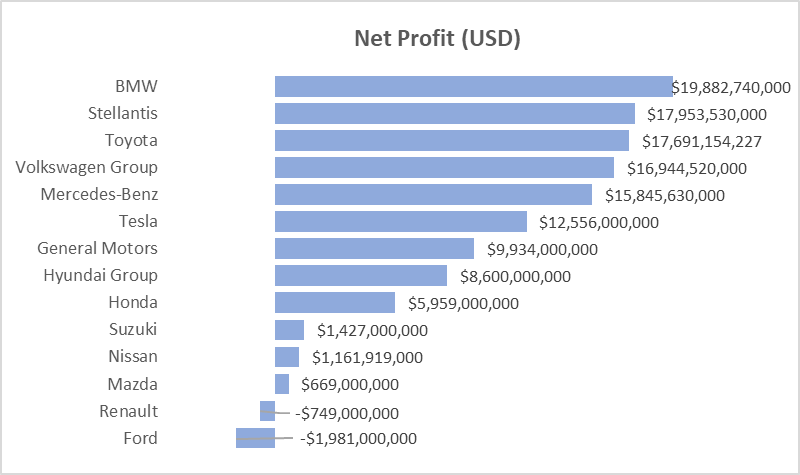
Here is where things get interesting. When we look at profitability – that is, a company’s actual profit after working expenses not included in the calculation of gross profit have been paid – it was BMW that took the number one spot with nearly $20 billion in profits in its fiscal year 2022.
The second most profitable company, Stellantis, also comes as a surprise since many industry analysts and auto enthusiasts like to criticize the automotive conglomerate for supposedly consisting of brands that are on life-support, brands not many buyers don’t like. It beat the Hyundai Group by more than double the net profits despite selling fewer vehicles.
Toyota and the Volkswagen Group both earned above $15 Billion in profit, placing fourth and fifth, respectively. However, that’s not particularly impressive when you consider that both high-volume manufacturers sell substantially more vehicles than any other automaker, including Stellantis, another high-volume automaker.
BMW, Mercedes-Benz, and Tesla brought in a lot of profit due to being premium automotive groups. Tesla’s result is particularly impressive seeing as the company made the fewest number of vehicles after Mazda.
Ford and Renault came in last because they lost money in 2022, demonstrating just how deceptive sales volume and revenue are at gauging a company’s success.

Operating profit can be an even more insightful way of assessing a company’s performance because, unlike net profit, it is less affected by business activities that are not directly related to the fiscal year’s operations.
Volkswagen Group had the highest operating profit in 2022, but Mercedes-Benz and Stellantis were not too far behind. Tesla performed just as well as it did with net profits at the number six spot, while BMW drops from the number one spot to fifth.
Ford and Renault jump from the bottom spots to 10th and 11th, respectively, because they earned billions in operating profit despite each having a negative net profit.
Ranking by Profit Margin

A better way to compare profitability between companies is to look at their profit as a percentage of their total revenue. Ranking by profit margin, Tesla was the clear winner with a 15 percent margin, followed by BMW in second with 13 percent and Mercedes-Benz in third with nearly a 10 percent margin.
Stellantis was the best-performing full-line, high-volume automaker, placing fourth with an almost double-digit net profit margin, while Toyota, the Volkswagen Group, General Motors, the Hyundai Group, and Honda all clustered in the 5 to 7 percent range, which is the average range for the overall industry (source).
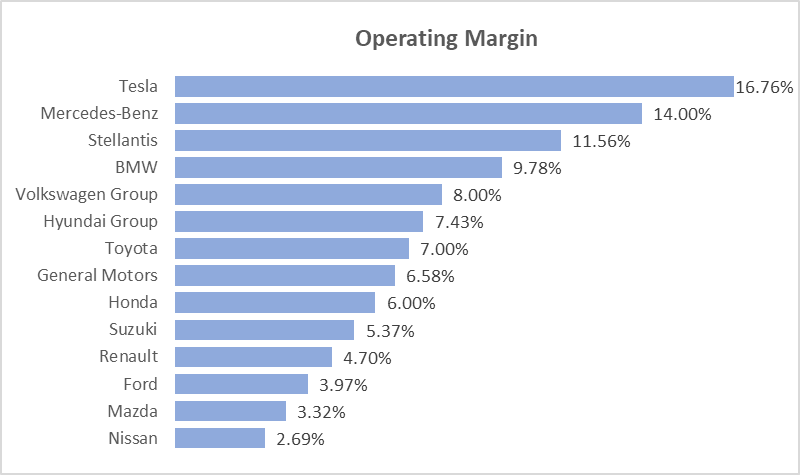
If we go by operating net profit margin instead, Tesla still dominated the industry, trailed closely by Mercedes-Benz. Stellantis beat BMW for third place and is the only full-line automaker to have a double-digit return.
An 8 percent operating margin is a decent return for a full-line automaker. Aside from Stellantis, the Volkswagen Group is the only other automaker to meet that benchmark.
Ranking by Profit Per Vehicle
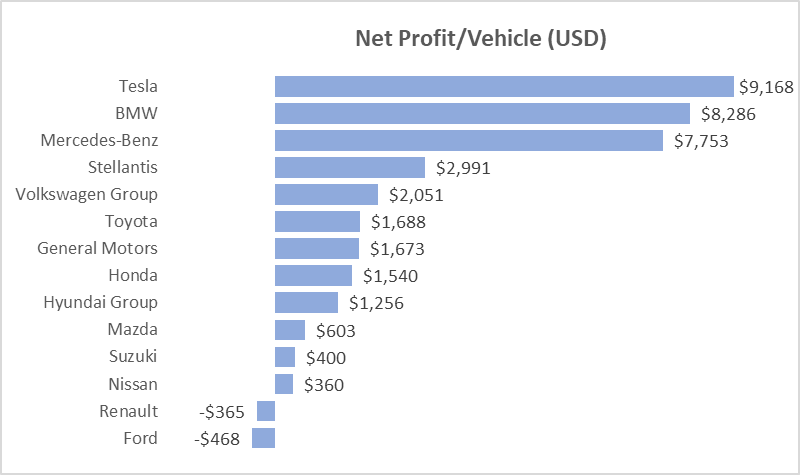
To the average person, profit per vehicle is a less vague metric than profit margin. It is an automaker’s profit divided by the total number of vehicles it sold.
Tesla was once again top of the class as far as net profits is concerned, making over $9,000 on every vehicle it sold. BMW also delivered impressive results, beating German archrival Mercedes-Benz.
A few things to note here. First, electric vehicles have long been blasted for being too expensive to produce and too unaffordable, but Tesla’s success shows otherwise.
Second, while it’s understandable for premium automakers like Mercedes-Benz, BMW, and Tesla to have higher margins due to typically charging higher prices for their vehicles than full-line, high-volume automakers, one would think the size and vertical integration of the full-line automakers and the economies of scale afforded to them would help offset such a price disadvantage. But that doesn’t appear to be the case.
The Volkswagen Group and Toyota, the largest automakers in the world by a long shot, are found in fifth and sixth place, respectively, beaten even by the much smaller Stellantis.
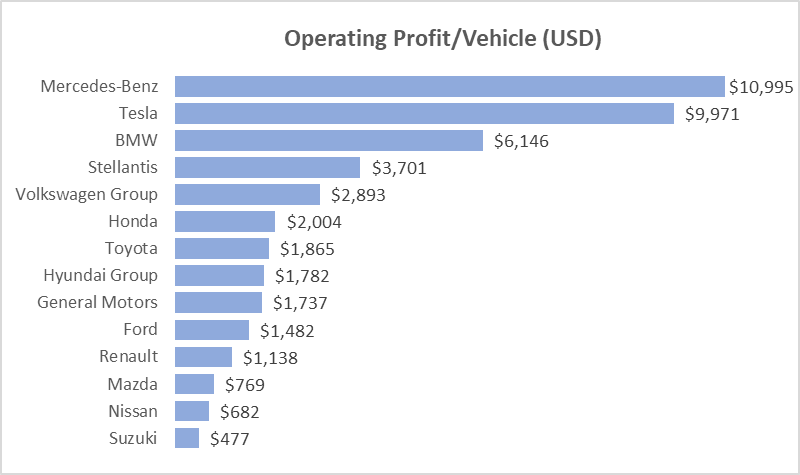
It’s the same story with operating profit per vehicle. BMW, Tesla, and Mercedes-Benz handily beat every full-line automaker by large margins.
Ranking by Revenue Per Employee

Another great way to evaluate how well an automaker is managed is to look at the revenue generated by each of its employees, a ratio that’s both a profitability and a productivity metric. To calculate it, we simply take the company’s total sales and divide it by the total number of employees.
The results are less predictable this time around, with BMW topping the list as the only automaker to generate $1 million per employee, but Mercedes-Benz and General Motors aren’t too far behind.
Ford, which has landed near the bottom in most of the charts, also generated over $800,000 per head with a strong showing in fourth place, but every other automaker made less.
The Volkswagen Group is at the bottom because, with over 650,000 employees, it employs substantially far more people than any other car manufacturer, including Toyota. In fact, there are more Volkswagen Group employees than there are General Motors, Ford, and Stellantis employees combined!
Ranking by Profit Per Employee
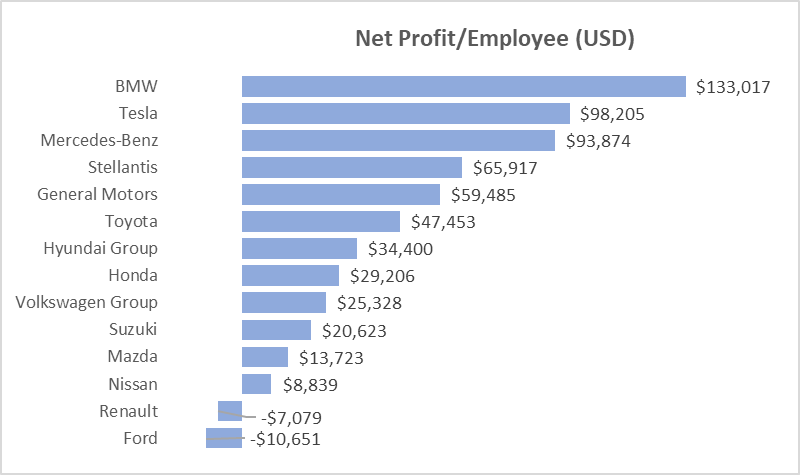
A higher sales-per-employee ratio should indicate that a company can do more with fewer employees, which often translates into healthy profits, but that’s not always the case.
It often helps to make sure that each employee is indeed generating a profit for the company, and that’s where the profit per employee metric comes in, calculated by taking a company’s profit and dividing it by the total number of employees.
As with the revenue per employee, BMW earned the highest net profit per each of its employees. Tesla jumps from the middle of the pack to second place, followed closely by Mercedes-Benz. Stellantis and General Motors performed better than every other full-line automaker.
The Volkswagen Group still didn’t perform well due to its massive employee base, but it fared much better than Nissan, Renault, and Ford.

The results are much the same with operating profit per employee, with the most notable change being Mercedes-Benz switching places with BMW for the top spot.
Tesla still sits at number two, while the Volkswagen Group remains in the bottom half. Ford moved up four positions.
Final Grade
| Groupe | Operating Profit | Net Profit | Op. Margin | Profit Margin | Op. Profit/Unit | Net Profit/Unit | Revenue / Emp. | Op. Profit/Emp. | Net Profit/Emp. | Total | Grade |
| Mercedes-Benz | 65 | 50 | 65 | 60 | 70 | 60 | 65 | 70 | 60 | 565 | A+ |
| BMW | 50 | 70 | 55 | 65 | 60 | 65 | 70 | 60 | 70 | 565 | A+ |
| Tesla | 45 | 45 | 70 | 70 | 65 | 70 | 35 | 65 | 65 | 530 | A+ |
| Stellantis | 60 | 65 | 60 | 55 | 55 | 55 | 45 | 55 | 55 | 505 | A+ |
| Toyota | 55 | 60 | 40 | 45 | 40 | 45 | 50 | 45 | 45 | 425 | A- |
| General Motors | 35 | 40 | 35 | 50 | 30 | 40 | 60 | 50 | 50 | 390 | B+ |
| Volkswagen Group | 70 | 55 | 50 | 40 | 50 | 50 | 5 | 30 | 30 | 380 | B+ |
| Hyundai Group | 40 | 35 | 45 | 35 | 35 | 30 | 40 | 40 | 40 | 340 | B |
| Honda | 30 | 30 | 30 | 30 | 45 | 35 | 30 | 35 | 35 | 300 | B |
| Ford | 25 | 5 | 15 | 10 | 25 | 5 | 55 | 25 | 5 | 170 | C |
| Suzuki | 10 | 25 | 25 | 25 | 5 | 20 | 10 | 20 | 25 | 165 | C |
| Mazda | 5 | 15 | 10 | 20 | 15 | 25 | 20 | 10 | 20 | 140 | C- |
| Renault | 20 | 10 | 20 | 5 | 20 | 10 | 15 | 15 | 10 | 125 | C- |
| Nissan | 15 | 20 | 5 | 15 | 10 | 15 | 25 | 5 | 15 | 125 | C- |
| Average | 38 | 38 | 38 | 38 | 38 | 38 | 38 | 38 | 38 | 338 | B |
Now that we have looked at how well each company performed in all the categories evaluated, let’s grade them. I used an objective, points-based methodology for this assessment.
First, I ranked each of the 14 automakers for every category and assigned points to their respective placing. The points increased by increments of 50, so the higher the rank, the higher the points earned.
I then added all the points earned for every category to arrive at a total score for each automaker and, using a grading scale, assigned a letter grade to that score.
The highest possible score is 630, while the lowest is 45. The average calculated score is 338.
As you can see from the results, BMW and Mercedes-Benz were the best-performing automakers in 2022, both achieving the same score and grade. Tesla wasn’t too far behind in third place.
It’s worth pointing out once again that BMW, Mercedes-Benz, and Tesla primarily manufacture and sell luxury vehicles at premium prices, which gives them an advantage over high-volume automakers. That makes Stellantis’ performance especially impressive, seeing as it performed nearly as well as Tesla did.
Toyota is the only other high-volume automaker to fall in the ‘A’ grade range. General Motors, the Volkswagen Group, the Hyundai Group, and Honda all clustered together in the ‘B’ grade range, while Honda, Ford, Suzuki, Mazda, Renault, and Nissan each scored below average in the ‘C’ grade range.
I hope this analysis comparing the performance of the world’s largest automakers in 2022 provided you with a better perspective of how well these companies were managed and where they truly stand in the global pecking order.
[ad_2]