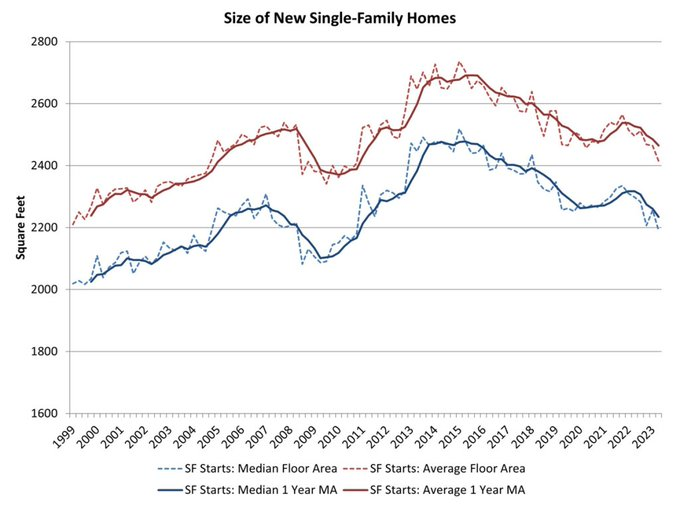
I came across this chart in Charlie Bilello’s weekly newsletter:

What it shows is the average size of new single-family houses in the US. And what it tells us is that median and average floor areas are falling. They are now roughly back to where they were in 2010, following the 2007-2008 financial crisis. This is noteworthy because it shows that homebuilders are responding to lower affordability. Interest rates went up, buyers can now afford less home, and so the market is responding by shrinking square footages to reduce sticker prices. It is the same reason that condominiums also tend to follow a similar size trendline (at least here in Toronto); it’s about affordability. That said, if you go back even further in the above chart — to 1999 — the trendline is up and to the right. Meaning that when the market allows, the average new single-family house is generally getting bigger. That also tells us something.
Discover more from reviewer4you.com
Subscribe to get the latest posts to your email.


