Most ecommerce entrepreneurs are driven by the huge business growth potential and profit opportunities available in the information super highway.
But how do you know if your ecommerce business is thriving or barely surviving? That’s where ecommerce metrics come in.
Ecommerce metrics can serve as your data-driven guide as you shape strategies, drive sales, and ultimately define the customer experience.
Let’s cover some of the basic ecommerce metrics that will provide insights into your venture’s place in the online seascape and help you get to your desired destination.
Here are a few ecommerce metrics to track, including formulas, benchmarks, and actionable tips.
Conversion Rate (CR)
Also called ecommerce conversion rate or sales conversion rate, this is one of the key ecommerce metrics as it measures the percentage of website visitors who make a purchase.
Conversion rates provide insight into the effectiveness of your site and marketing efforts in converting visitors into paying customers.
- Formula. CR = (Number of Sales / Number of Visitors) x 100
- Example. If your site receives 10,000 visitors in a month and 200 of them make a purchase, your CR is 2%.
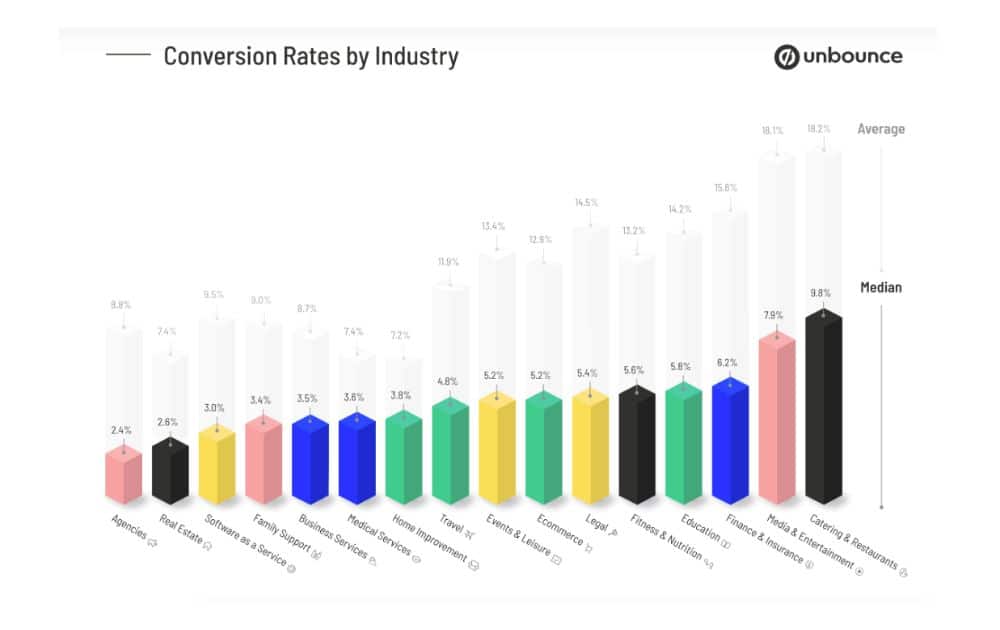
- Benchmark. Shopify says ecommerce conversion metrics around 2.5% are a good place to start in 2024. However, it’s crucial to note that conversion rates can vary by industry. For instance, the Unbounce Conversion Benchmark Report cites varying landing page conversion rates depending on the nature of offerings.

- Actionable Tip: Improve your CR by optimizing your checkout process, making it as simple and frictionless as possible.
Customer Acquisition Cost (CAC)
Customer Acquisition Cost (CAC) calculates the cost associated with convincing a customer to buy a product or service.
This is one of the key metrics for ecommerce that allows you to understand the value of customer relationships.
- Formula. CAC = Total Costs in Marketing and Sales / Number of New Customers Acquired
- Example. A business that spends $1,000 on marketing and is able to acquire 100 new customers will have a CAC of $10.
- Benchmark. See CLV
- Actionable Tip. If you want to lower your CAC, focus on improving your conversion rates and optimizing your marketing campaigns.
Customer Lifetime Value (CLV)
Customer Lifetime Value, or CLV, pertains to the total amount of revenue that a venture business can expect from a single customer account. This is a performance metric that can help you strategize your marketing efforts and resource allocation.
- Formula. CLV = (Average Purchase Value x Purchase Frequency) x Average Customer Lifespan
- Example. If customers spend an average of $50, shop five times a year, and stay for four years, CLV is $1,000.
- Benchmark. What constitutes an ideal CLV can vary significantly across different businesses and industries. However, a common benchmark for success is achieving a CLV that is at least three times greater than the CAC, as cited by OWOX BI. This ratio indicates a healthy balance between the cost of acquiring customers and the value they bring over their lifetime.
- Actionable Tip. Boost CLV by improving the customer experience and increasing engagement through personalized communication.
Average Order Value (AOV)
Next on our list of ecommerce metrics is average order value or AOV. This metric tracks the average amount spent every time someone places an order. This metric examines customer spending behavior to guide decisions related to pricing and marketing decisions.
- Formula. AOV = Amount of Total Revenue / Number of Orders
- Example. If your store’s total sales are $10,000 from 200 orders, your AOV is $50.
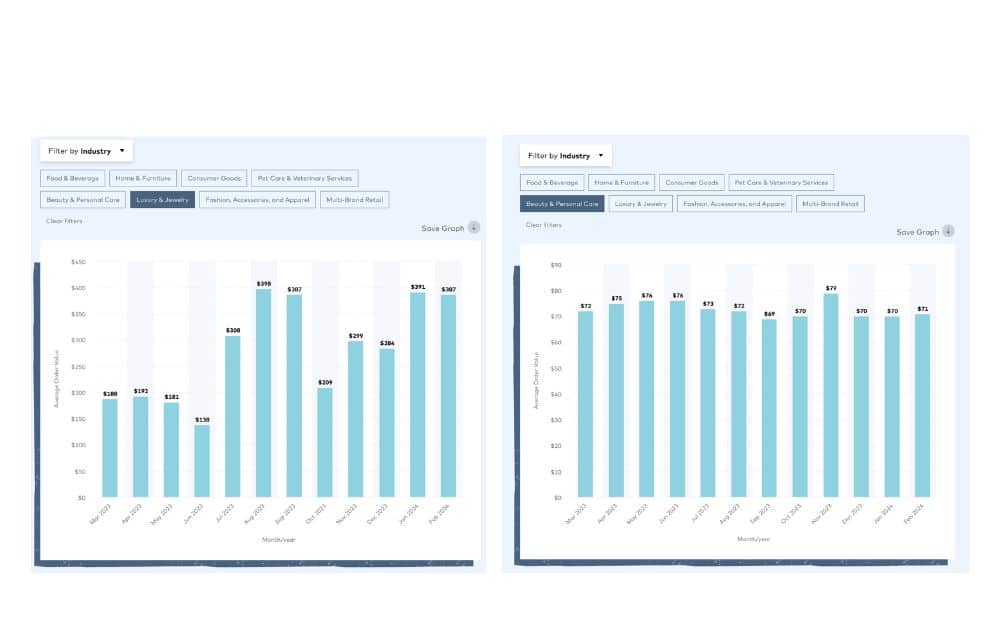
- Benchmark. Just like many ecommerce growth metrics, AOV benchmarks can vary greatly by industry. For instance, data from Dynamic Yield recorded an AOV of $387 for luxury and jewelry products in February 2024, and an AOV of $71 for the beauty and personal care industry during the same period.

- Actionable Tip. Recommend related products or implement a minimum spend for free shipping to increase AOV and boost inventory performance.
Customer Retention Rate (CRR)
Customer Retention Rate (CRR) measures the percentage of customers who remain engaged with your brand over a specific period.
Among ecommerce retention metrics, CRR is a vital indicator of customer satisfaction and loyalty. CRR can be combined with funnel metrics to offer a comprehensive view of both customer loyalty and the effectiveness of the sales process.
- Formula. CRR = [(Number of customers at end of period – New customers acquired during the period) / Number of customers at the start of the period] x 100
- Example. Starting with 100 customers, you end with 120 but acquire 30 new customers. Your CRR is 75%.
- Benchmark. Data cited by Exploding Topics lists media and professional services as the industries with the highest retention rates at 84%. On the other hand, hospitality, travel, and restaurant industries have the lowest retention rates of just 55%.
- Actionable Tip: Enhance CRR by implementing loyalty programs and engaging customers through personalized marketing.
Cart Abandonment Rate
The Cart Abandonment Rate measures the percentage of shoppers who add items to their shopping cart but exit without completing the purchase.
Amazon reports, and other industry studies, often highlight this rate as a significant indicator of ecommerce site performance and customer experience efficiency.
A high cart abandonment rate can notably impact organic sales, as it represents potential revenue that doesn’t materialize.
- Formula. Cart Abandonment Rate = [1 – (Number of Completed Purchases / Number of Shopping Carts Created)] x -100
- Example. If 1,000 shopping carts are created in a month but only 300 lead to purchases, the Cart Abandonment Rate is [1 – (300/1000)] x -100 = 70%.
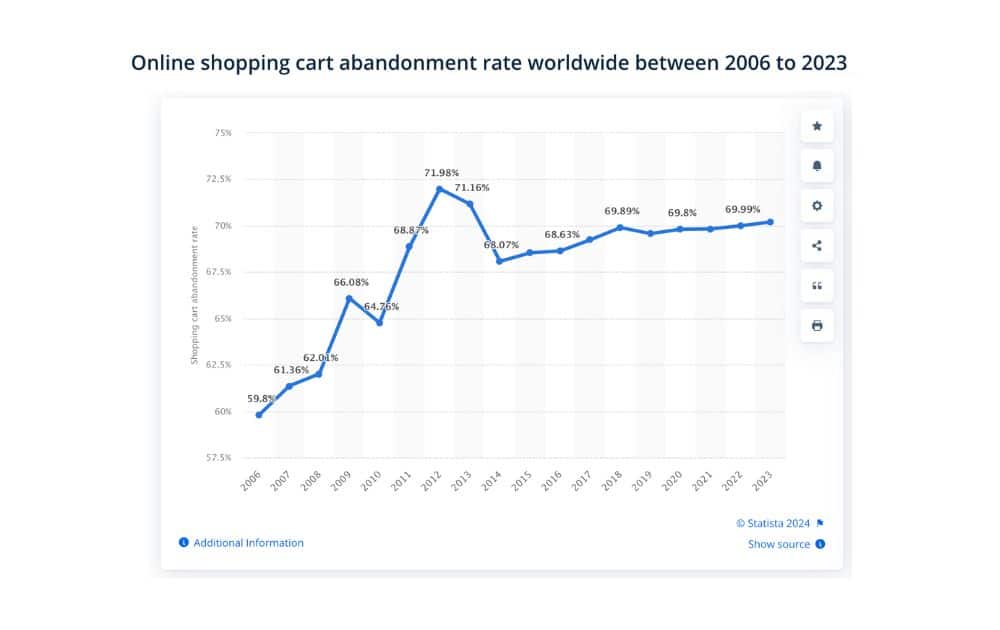
- Benchmark. Data from Statista reveals that since 2014, cart abandonment rates have been on a consistent upward trend. In 2023, the proportion of online shopping carts abandoned reached 70%, marking the highest rate since 2013.

- Actionable Tip. Reduce cart abandonment by streamlining the checkout process, offering multiple payment options, and sending reminder emails to customers who have left items in their carts.
Return on Ad Spend (ROAS)
Return on Ad Spend or ROAS is a crucial indicator within the array of ecommerce metrics, gauging the efficiency of advertising expenditures in driving revenue.
By tracking ROAS, businesses can ensure that every dollar spent on ads is an investment toward profitable growth. This metric transcends basic ecommerce business metrics by offering a direct correlation between marketing efforts and financial outcomes.
- Formula. ROAS = Income Earned from the Ads / Ad Expenses
- Example. If you spend $5,000 on a campaign and generate $20,000 in sales, your ROAS is $20,000 / $5,000 = 4, or 4:1.
- Benchmark. While the ideal ratio can, again, vary by industry, a 4:1 ratio or $4 sales for every $1 ad spend is a good benchmark.
- Actionable Tip. Improve your ROAS by targeting your ads more precisely and optimizing your ad creatives based on performance data.
Net Promoter Score (NPS)
Net Promoter Score or NPS emerges as a critical figure among ecommerce metrics, offering a straightforward yet profound insight into customer loyalty and satisfaction.
NPS quantifies the likelihood of customers recommending a business to others, serving as a barometer for evaluating customer service and marketing metrics.
Beyond merely reflecting customer sentiment, NPS intertwines with engagement metrics, highlighting areas where a business can enhance its interactions and communications to foster a more loyal and enthusiastic customer base.
- Formula. NPS = % of Promoters – % of Detractors. Promoters are those who score 9-10 on the likelihood to recommend your product, passives score 7-8, and detractors score 0-6.
- Example. If 50% of respondents are promoters, 20% are passives, and 30% are detractors, your NPS is 50% – 30% = 20.
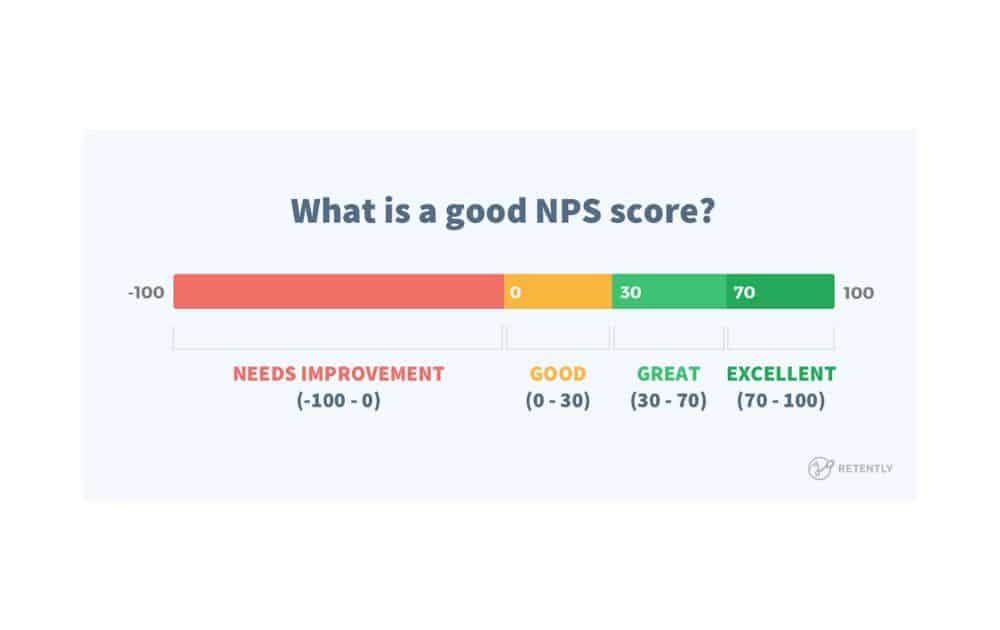
- Benchmark. According to Retently, an NPS below 0 signals that a business has numerous challenges that need immediate attention. An NPS between 0 and 30 is considered positive, with potential for further enhancement, while a score above 30 signifies a thriving business. Data cited by Userpilot reveals that the average NPS in the ecommerce industry is 45.

- Actionable Tip. Enhance your NPS by addressing customer complaints swiftly and focusing on improving the overall customer experience.
Refund and Return Rates
Refund and Return Rates are critical ecommerce metrics that assess customer satisfaction and product quality within an online shopping environment.
These website metrics reflect the percentage of products returned by customers relative to the total number of sales, offering insights into potential issues with product descriptions, customer expectations, or quality control.
A high rate of returns and refunds can signal the need for improvements in various areas of the ecommerce experience, from enhancing product imagery and descriptions to revising quality assurance processes.
- Formula. Refund Rate = (Number of Products Returned / Number of Products Sold) x 100
- Example. If you sell 1,000 items and 100 are returned, your refund rate is (100 / 1,000) x 100 = 10%.
- Benchmark. A McKinsey Returns Management Survey showed that in 2020, American consumers returned an astounding $428 billion worth of goods, resulting in a return rate of 10.6%. Ecommerce returns accounted for nearly a quarter of the total volume.
- Actionable Tip. Reduce returns by providing detailed product descriptions, accurate sizing guides, and high-quality images.
The Bottom Line
Remember, these ecommerce metrics are insights into the health of your business. Use them as signals for when to adjust your sails and opportunities to discover new horizons.
As you continue to track, analyze, and act upon these metrics, let them guide your strategic decisions, from refining your product offerings to enhancing customer engagement and loyalty.
Author
 Carla Bauto Deña is a journalist and content writer producing stories for traditional and digital media. She believes in empowering small businesses with the help of innovative solutions, such as e-commerce, digital marketing, and data analytics.
Discover more from reviewer4you.com
Subscribe to get the latest posts to your email.


